

More than 1 in 5 self-employed buyers who applied to multiple lenders reported an earlier turn-down
More than 1 in 5 self-employed buyers who applied to multiple lenders reported an earlier turn-down

 Written by Bill Lyons


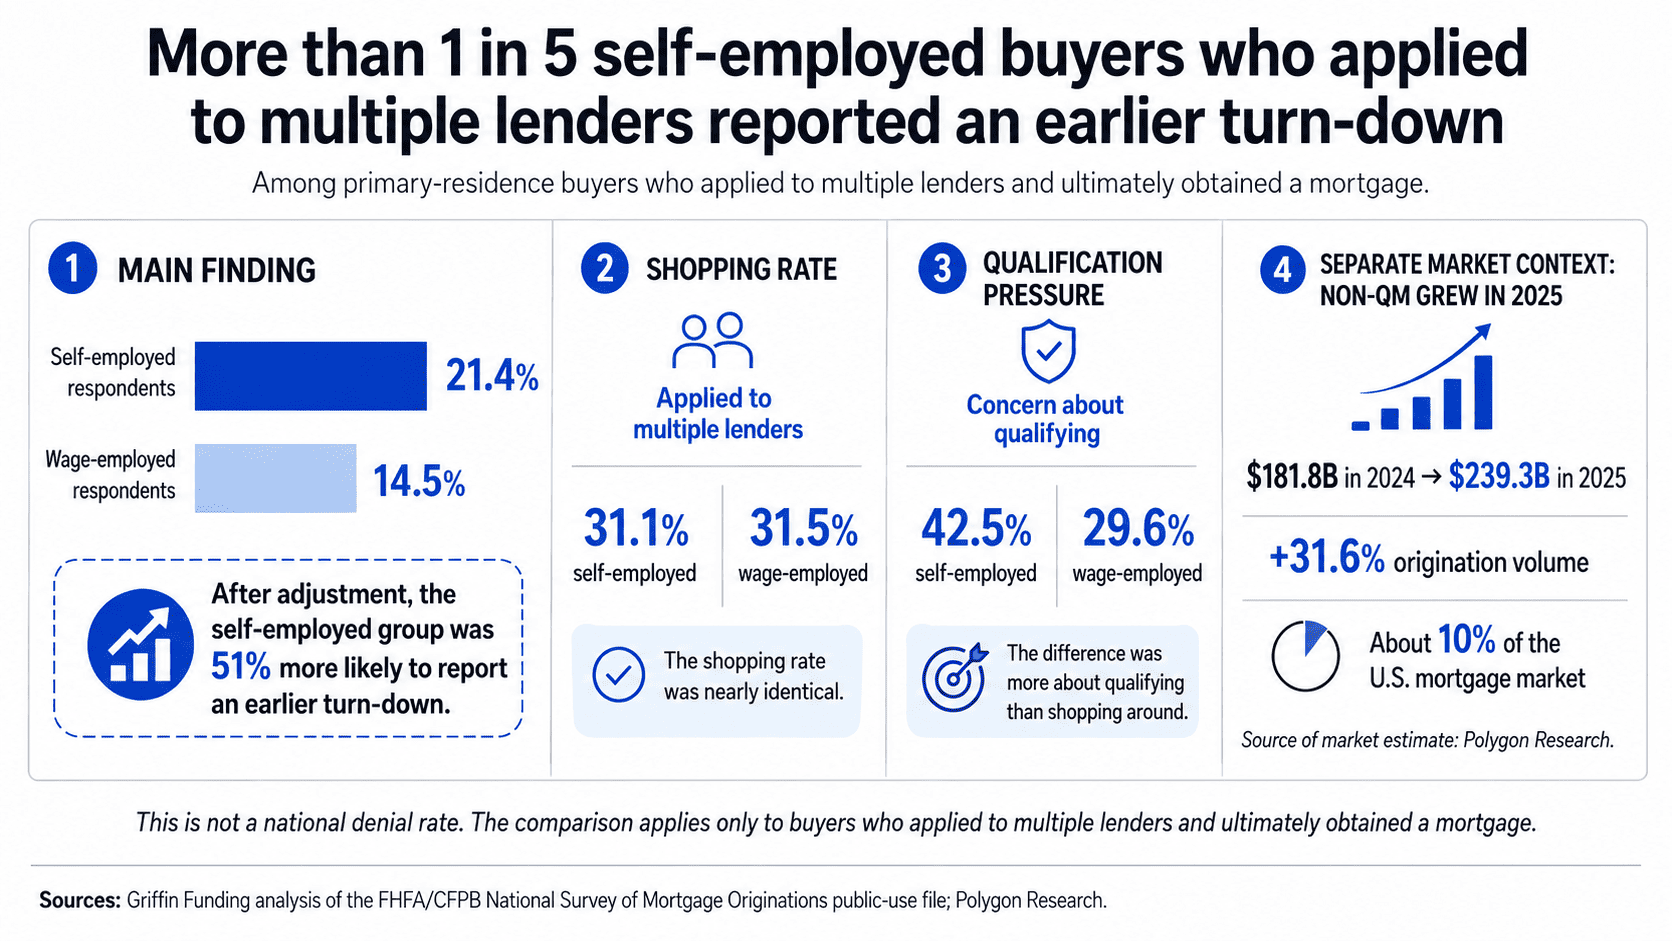
Among primary-residence buyers who applied to multiple lenders and ultimately closed, 21.4% of respondents reporting self-employment said an earlier application had been turned down, compared with 14.5% of wage-employed respondents, according to a new analysis from Griffin Funding. Separately, Polygon Research estimates non-qualified mortgage (non-QM) origination volume rose 31.6% in 2025 to $239.3 billion.
Self-employed buyers shopped for mortgages at almost exactly the same rate as wage-employed buyers. The surprise is why some of them were shopping. About 31.1% of respondents reporting self-employment applied to more than one lender, compared with 31.5% of wage-employed respondents. After adjustment, there was still no meaningful difference between the groups.
Among the buyers who did apply to multiple lenders, the experience looked different. A Griffin Funding analysis of the FHFA/CFPB National Survey of Mortgage Originations public-use file found that 21.4% of respondents reporting self-employment said an earlier mortgage application had been turned down, compared with 14.5% of wage-employed respondents. After adjustment, the self-employed group was 51% more likely to report an earlier turn-down.
Every buyer in that headline group eventually got a mortgage. So this is not saying one in five self-employed homebuyers were denied and never got a loan. It says that among buyers who had to apply to more than one lender before reaching the closing table, an earlier “no” showed up more often in the self-employed group.
Non-QM was growing fast on a separate track
That finding lands in a mortgage market that has been changing quickly. A separate Griffin Funding analysis highlighted Polygon Research’s HMDA-based estimate that non-QM origination volume grew from $181.8 billion in 2024 to $239.3 billion in 2025, a 31.6% jump. Loan count rose 24.7%, to 697,605 originations, and non-QM reached about 10% of the U.S. mortgage market by dollar volume and 10.2% by loan count. Because HMDA does not contain an official non-QM flag, Polygon uses a rules-based classification methodology tied to the ATR/QM framework.
Non-QM is a broad category, not a synonym for self-employed lending. It includes DSCR loans, alternative-documentation mortgages, interest-only structures and other loans that fall outside the Qualified Mortgage framework. But bank statement loans are one important part of that market because they can document qualifying income through bank deposits rather than relying only on tax returns.
The federal survey cannot tell us whether the borrowers who reported an earlier turn-down later used non-QM financing. The datasets are separate. What they show, side by side, is a mortgage market where self-employed buyers report more qualification friction while a much larger share of lending is being built around borrowers and loan structures that do not fit neatly inside the traditional box.
For one Hawaii couple, the problem was not earning income. It was proving it.
One recent Griffin Funding purchase shows what that mismatch can look like in real life. A self-employed couple had been running their business since 2023 and were buying a primary residence in Hawaii. By early 2026, however, the 2025 business tax return had not yet been filed. For the conventional path they were considering, that left them without two full filed years of business tax returns. Their business had not suddenly stopped producing income. The problem was the documentation window.
Griffin moved the file to a bank statement loan and reviewed 12 months of business deposits. The higher-credit spouse became the qualifying borrower, and underwriting then had to document how long she had been self-employed and how much of the business income belonged to her. A CPA attestation supported at least two years of self-employment, while an operating agreement documented each spouse’s ownership share.
Even then, the file was not simple. In underwriting, deposits from a newer business account could not be counted because the account did not have 12 months of history. Qualifying income dropped, the debt-to-income ratio moved higher, and the loan had to be recalculated. The couple still closed in March 2026.
That loan was not part of the federal survey, and the record does not document an earlier lender turn-down. It belongs in this story for a narrower reason: it shows why alternative income documentation exists in the first place. For some self-employed borrowers, the question is not simply, “Do you earn enough?” It is, “Which income can this mortgage program actually document and count?”
The shopping rate was almost identical. The pressure to qualify was not.
Self-employed buyers were not applying to more lenders overall. But among those who did, qualification was more likely to be part of the reason.
Looking for better terms was common in both groups: 81.7% of self-employed multi-lender applicants and 83.6% of wage-employed applicants cited that reason. The adjusted difference was not statistically significant. Concern about qualifying told a different story. It was cited by 42.5% of self-employed multi-lender applicants, compared with 29.6% of wage-employed applicants. After adjustment, the self-employed group was 48% more likely to cite that concern.
Borrowers could choose more than one reason, so someone could be comparing rates and worrying about approval at the same time. The important point is simpler: the two groups shopped around at nearly the same rate, but self-employed borrowers were more likely to have a qualification problem in the background when they did.
The paperwork tells the same story
The earlier turn-down was only one sign of extra friction. Across the full 23,299-borrower analytical population, 73.2% of self-employed respondents had a follow-up request for more information about income or assets, compared with 67.7% of wage-employed respondents. After adjustment, the self-employed group was 9% more likely to have that follow-up request.
A five-and-a-half-point gap may not sound dramatic on paper. In a mortgage file, it can mean another statement, another explanation, another ownership document or another round of underwriting questions. The Hawaii couple ran into several of those steps in one purchase: bank statements, ownership documentation, a CPA attestation and then a last-minute question about which account history could actually be used.
Other survey questions point in the same direction. Among respondents with a valid answer to the co-signer question, 13.5% of the self-employed group said they had to add another co-signer to qualify, compared with 9.7% of the wage-employed group. After adjustment, self-employed respondents were 38% more likely to report that step.
Documentation satisfaction also differed. Among respondents with a valid answer to that question, 11.9% of the self-employed group were coded as “not at all satisfied,” compared with 7.6% of wage-employed respondents. After adjustment, that response was 56% more likely in the self-employed group.
These are not failure rates, and most self-employed borrowers did not report those outcomes. They are smaller pieces of the same picture: getting to closing sometimes required more explaining, more documentation and more back-and-forth.
Why self-employed income can take more explaining
Fannie Mae’s current Selling Guide for self-employed borrowers requires lenders to evaluate the stability of the income, analyze personal and, when applicable, business income or loss, and determine how much income can reasonably be relied on for the mortgage. The process includes a written cash-flow analysis or an approved equivalent method.
That is not a flaw in the underwriting process. A lender still has to determine whether the income is stable and whether the borrower can repay the loan. But a business owner can have far more moving pieces than a salaried employee: multiple accounts, ownership percentages, expenses, K-1 income, changing business structures and deposits that do not line up neatly with a pay stub.
Bank statement programs use a different documentation path. They review eligible deposits over a defined period and apply program-specific expense assumptions to determine qualifying income. They still involve credit standards, reserves, property requirements, debt-to-income limits and ability-to-repay analysis. The difference is the evidence used to establish income.
A bigger non-QM market does not erase the problem. It gives borrowers more paths through it.
The federal survey shows that among buyers who shopped multiple lenders and eventually closed, respondents reporting self-employment were more likely to report an earlier turn-down and more likely to say they were worried about qualifying. Separately, Polygon Research estimates non-QM originations grew 31.6% in 2025. The Hawaii purchase shows what one alternative-documentation path can look like when the issue is not a lack of business activity, but how much of that activity can be turned into qualifying mortgage income.
The data do not show that one caused the other. They show two sides of the same market: more qualification friction among self-employed buyers and a growing non-QM market built partly for borrowers whose finances do not fit traditional income documentation.
Methodology
Griffin Funding analyzed the May 27, 2026 public-use release of the National Survey of Mortgage Originations, jointly managed by the Federal Housing Finance Agency and Consumer Financial Protection Bureau. The release contains 62,359 sample mortgages originated from 2013 through 2024 across the first 46 processed survey waves.
The main analytical population contains 23,299 respondent-borrowers associated with purchase mortgages on current primary residences: 2,872 respondents reporting self-employment and 20,427 reporting wage employment without self-employment. The headline analysis is limited to 7,045 respondents who applied to more than one lender and had a coded earlier-turn-down response: 863 respondents reporting self-employment and 6,182 reporting wage employment.
Employment status was measured when respondents completed the survey after origination, not necessarily when they applied for the mortgage. The self-employed group includes full- and part-time self-employment, including some respondents who reported self-employment as a secondary work status. Results should therefore be read as associations among respondents reporting those work statuses, not proof that self-employment itself caused a lender decision.
Percentages were calculated using the official NSMO analysis weight. Adjusted risk ratios were estimated with weighted modified-Poisson models controlling for survey-time household-income category, age and age squared, education, sex, Hispanic status, race, marital status, origination credit score and origination year. The models do not control for every underwriting factor that could differ between the groups, including debt-to-income ratio, loan-to-value ratio, loan amount and property type.
For reference, the adjusted estimates were: applying to more than one lender, risk ratio 1.01 (approximate 95% CI 0.95 to 1.07); earlier turn-down, 1.51 (1.31 to 1.73); looking for better terms, 0.98 (0.95 to 1.02); concern about qualifying, 1.48 (1.36 to 1.61); follow-up request for income or asset information, 1.09 (1.06 to 1.12); adding another co-signer, 1.38 (1.24 to 1.54); and being “not at all satisfied” with documentation, 1.56 (1.38 to 1.75).
Survey routing, weighting and variable definitions were checked against FHFA’s Technical Documentation, Codebook and Unweighted Tabulations and Waves 45 and 46 questionnaire. The co-signer analysis included 19,055 valid responses: 2,484 from respondents reporting self-employment and 16,571 from the wage-employed comparison group. The documentation-satisfaction analysis included 19,119 valid responses: 2,488 and 16,631, respectively.
FHFA’s separate Select Weighted Tabulations, 2014-2024 provide official weighted tables for many NSMO questions but do not publish the self-employment cross-tabulations used here. The 21.4% and 14.5% turn-down rates, the other employment-group comparisons and the adjusted risk ratios are Griffin Funding calculations from the public-use file, not published FHFA statistics.
The public-use response variables can combine direct, edited and imputed answers. The file also does not provide the replicate weights and complete sample-design variables required for official FHFA variance estimates, so the confidence intervals reported here are model-based approximations rather than official FHFA confidence intervals.
Find the best loan for you. Reach out today!
Get Started
Bill Lyons is the Founder, CEO & President of Griffin Funding. Founded in 2013, Griffin Funding is a national boutique mortgage lender focusing on delivering 5-star service to its clients. Mr. Lyons has 25 years of experience in the mortgage business. Lyons is seen as an industry leader and expert in real estate finance. Lyons has been featured in Forbes, Inc., Wall Street Journal, HousingWire, and more. As a member of the Mortgage Bankers Association, Lyons is able to keep up with important changes in the industry to deliver the most value to Griffin's clients. Under Lyons' leadership, Griffin Funding has made the Inc. 5000 fastest-growing companies list six times in its 13 years in business. Follow his updates on LinkedIn.
 Outstanding Client Experience
 Specialized Lending Solutions
 Direct-to-Consumer Advantage
 We're Advisors, NOT Salespeople
 Effortless Digital Mortgage Platform
Featured In



Recent Posts
Average home equity gains topped $200,000 in six states as renters faced heavy housing costs
A rising home value can mean two very different things on the same street. For an established homeowner, it ca...

A 1-percentage-point mortgage rate rise can outrun 4 years of rent growth
The Federal Reserve raised interest rates on Sept. 16 for the first time since 2023. For rental property inves...
Conforming mortgages just lost their majority. Non-QM is helping drive the shift
Conforming mortgages accounted for nearly three-quarters of Optimal Blue’s rate-lock volume in July 2020...