

Average home equity gains topped $200,000 in six states as renters faced heavy housing costs
 Written by Bill Lyons


A rising home value can mean two very different things on the same street. For an established homeowner, it can add to a financial cushion. For a renter hoping to buy, it can move the starting line further away.
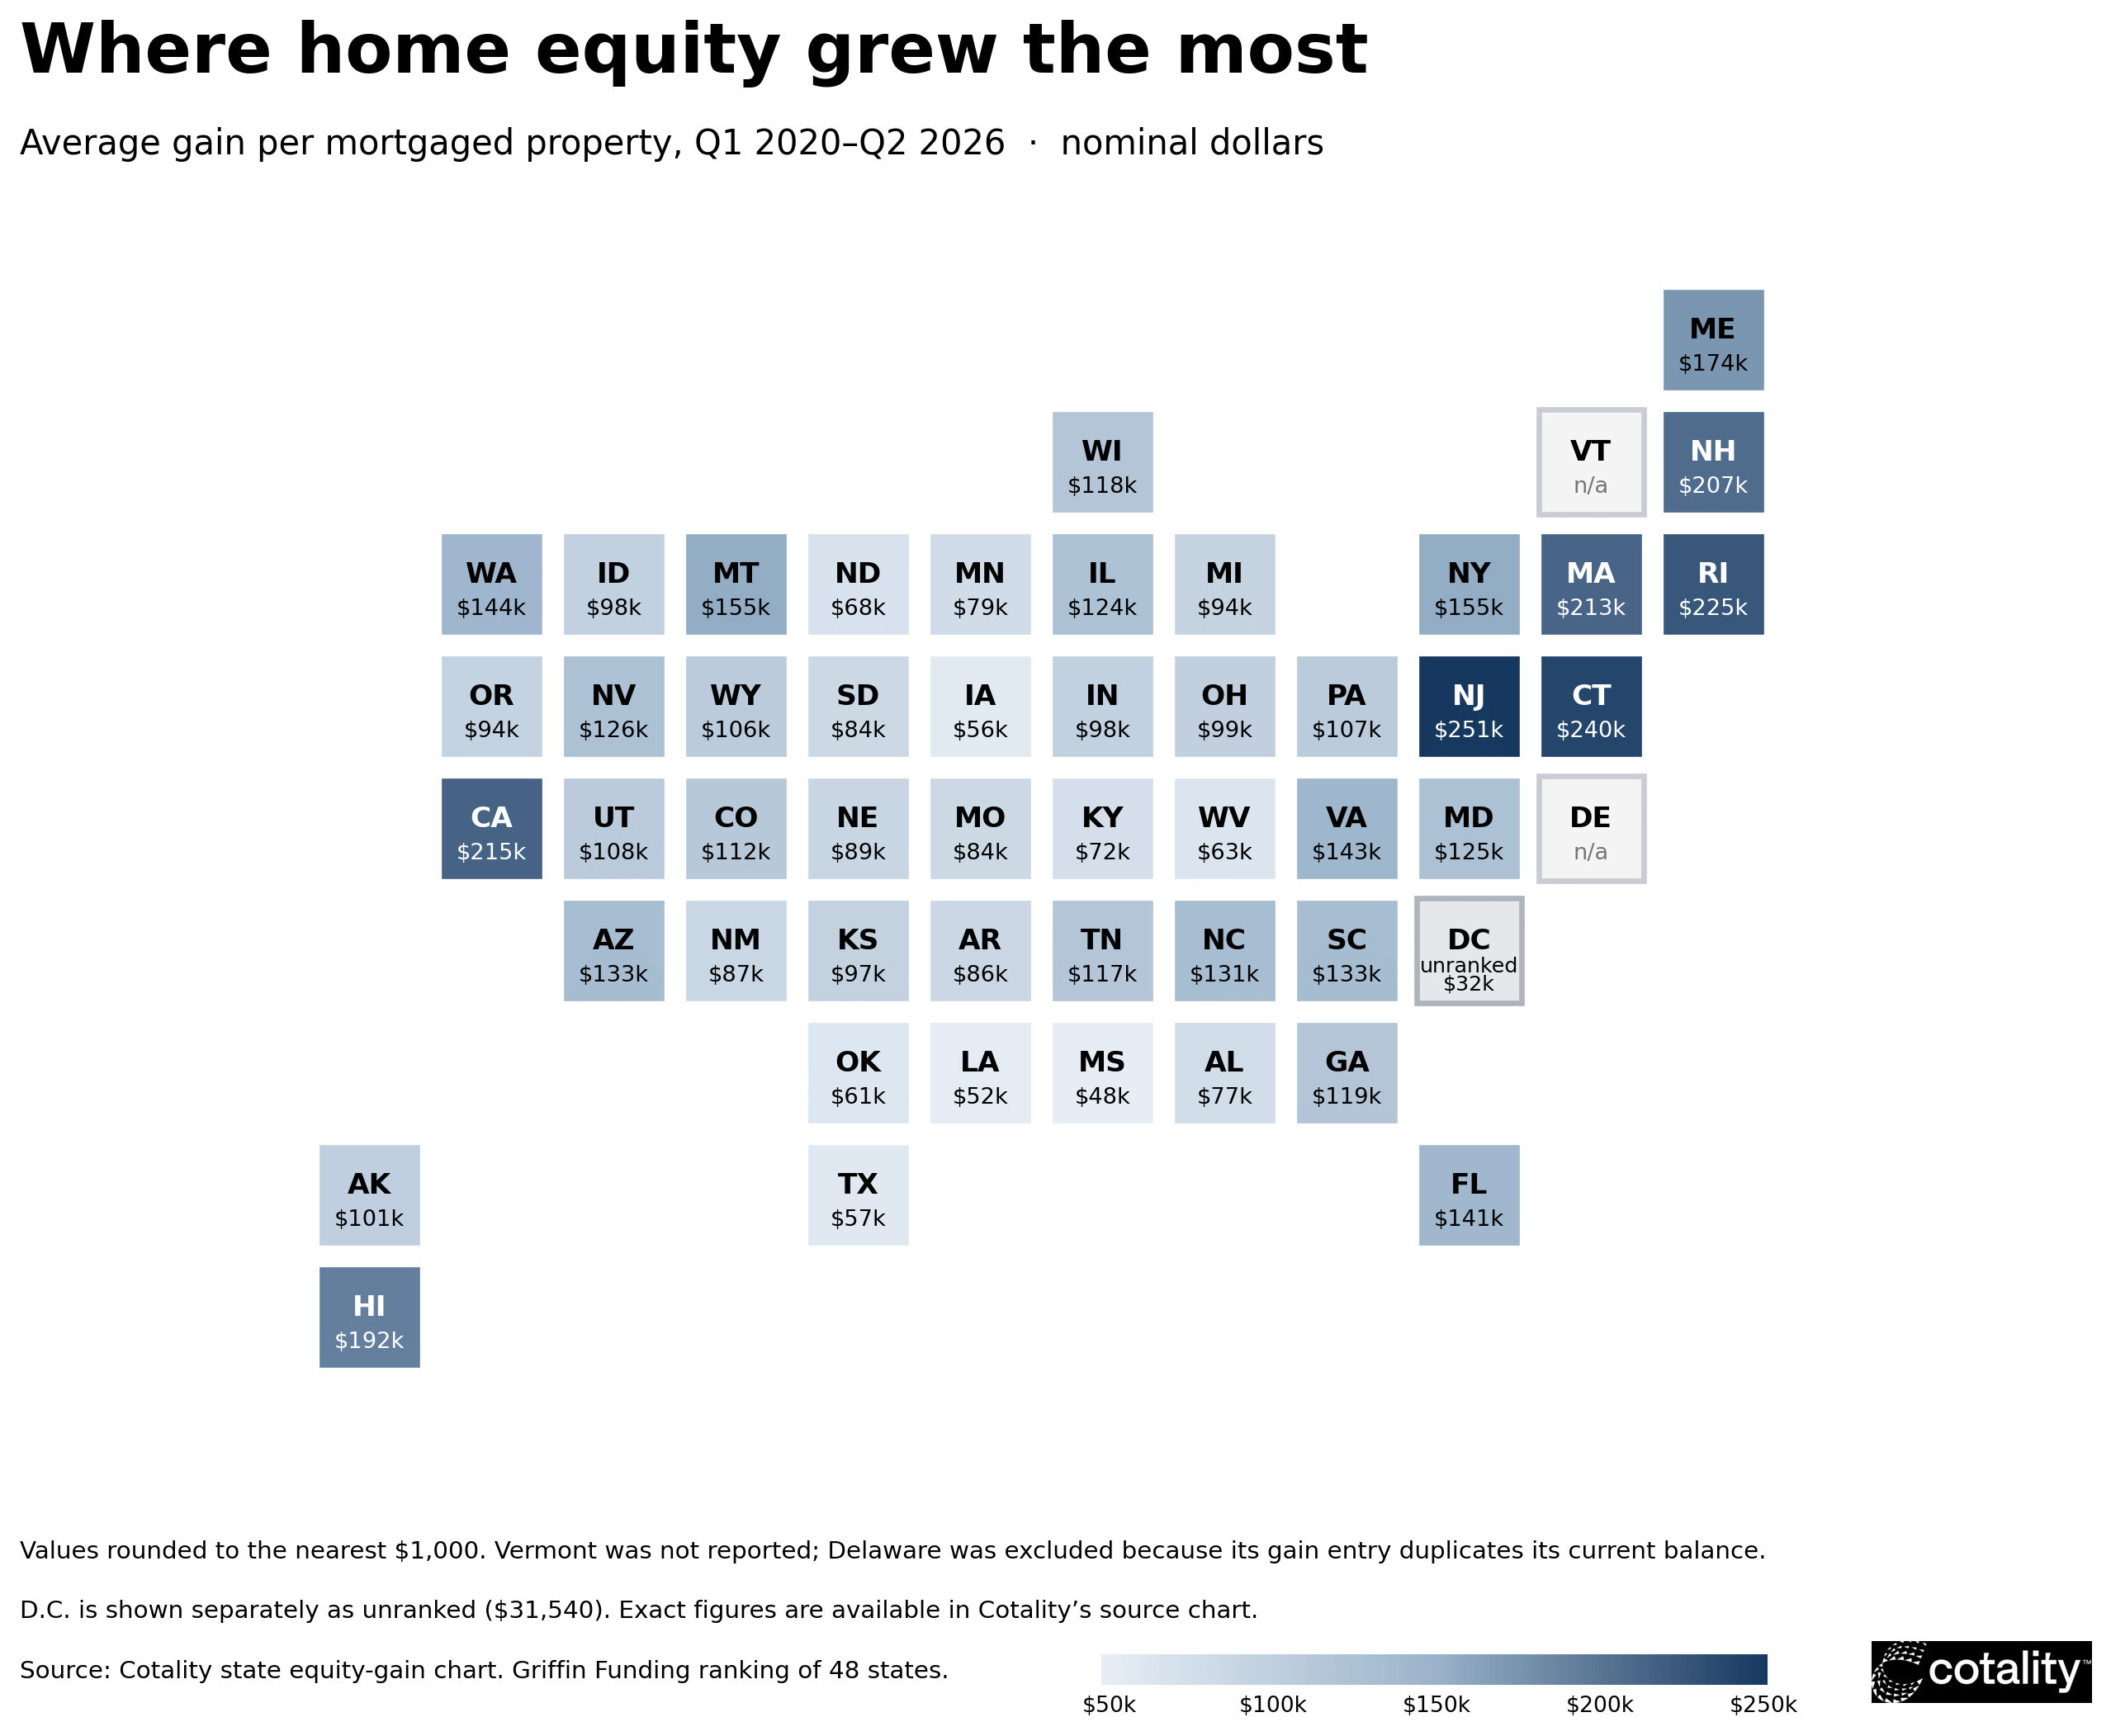
Griffin Funding ranked Cotality’s published state equity-gain data for the period from Q1 2020 to Q2 2026. Cotality, a data and analytics company, reports gains exceeding $200,000 in average equity per mortgaged property in six of the 48 states included here. New Jersey, Connecticut and Rhode Island lead the comparison; seven of its top 10 states are in the Northeast. The ranking measures cumulative dollar gains since 2020, not current equity balances or the share of mortgaged properties considered equity-rich.
Yet large gains for owners can coexist with strained renter budgets. In California and Connecticut, two states above that $200,000 threshold, more than half of renters were cost-burdened in 2024, spending over 30 percent of income on housing and utilities. Those are the latest annual renter-burden figures used in Harvard’s 2026 housing report.
Together, the figures highlight two sides of household financial security: the assets a family already holds and the money it has left to save. They do not measure a state-by-state change in the homeowner–renter wealth gap.
Six states crossed the $200,000 mark
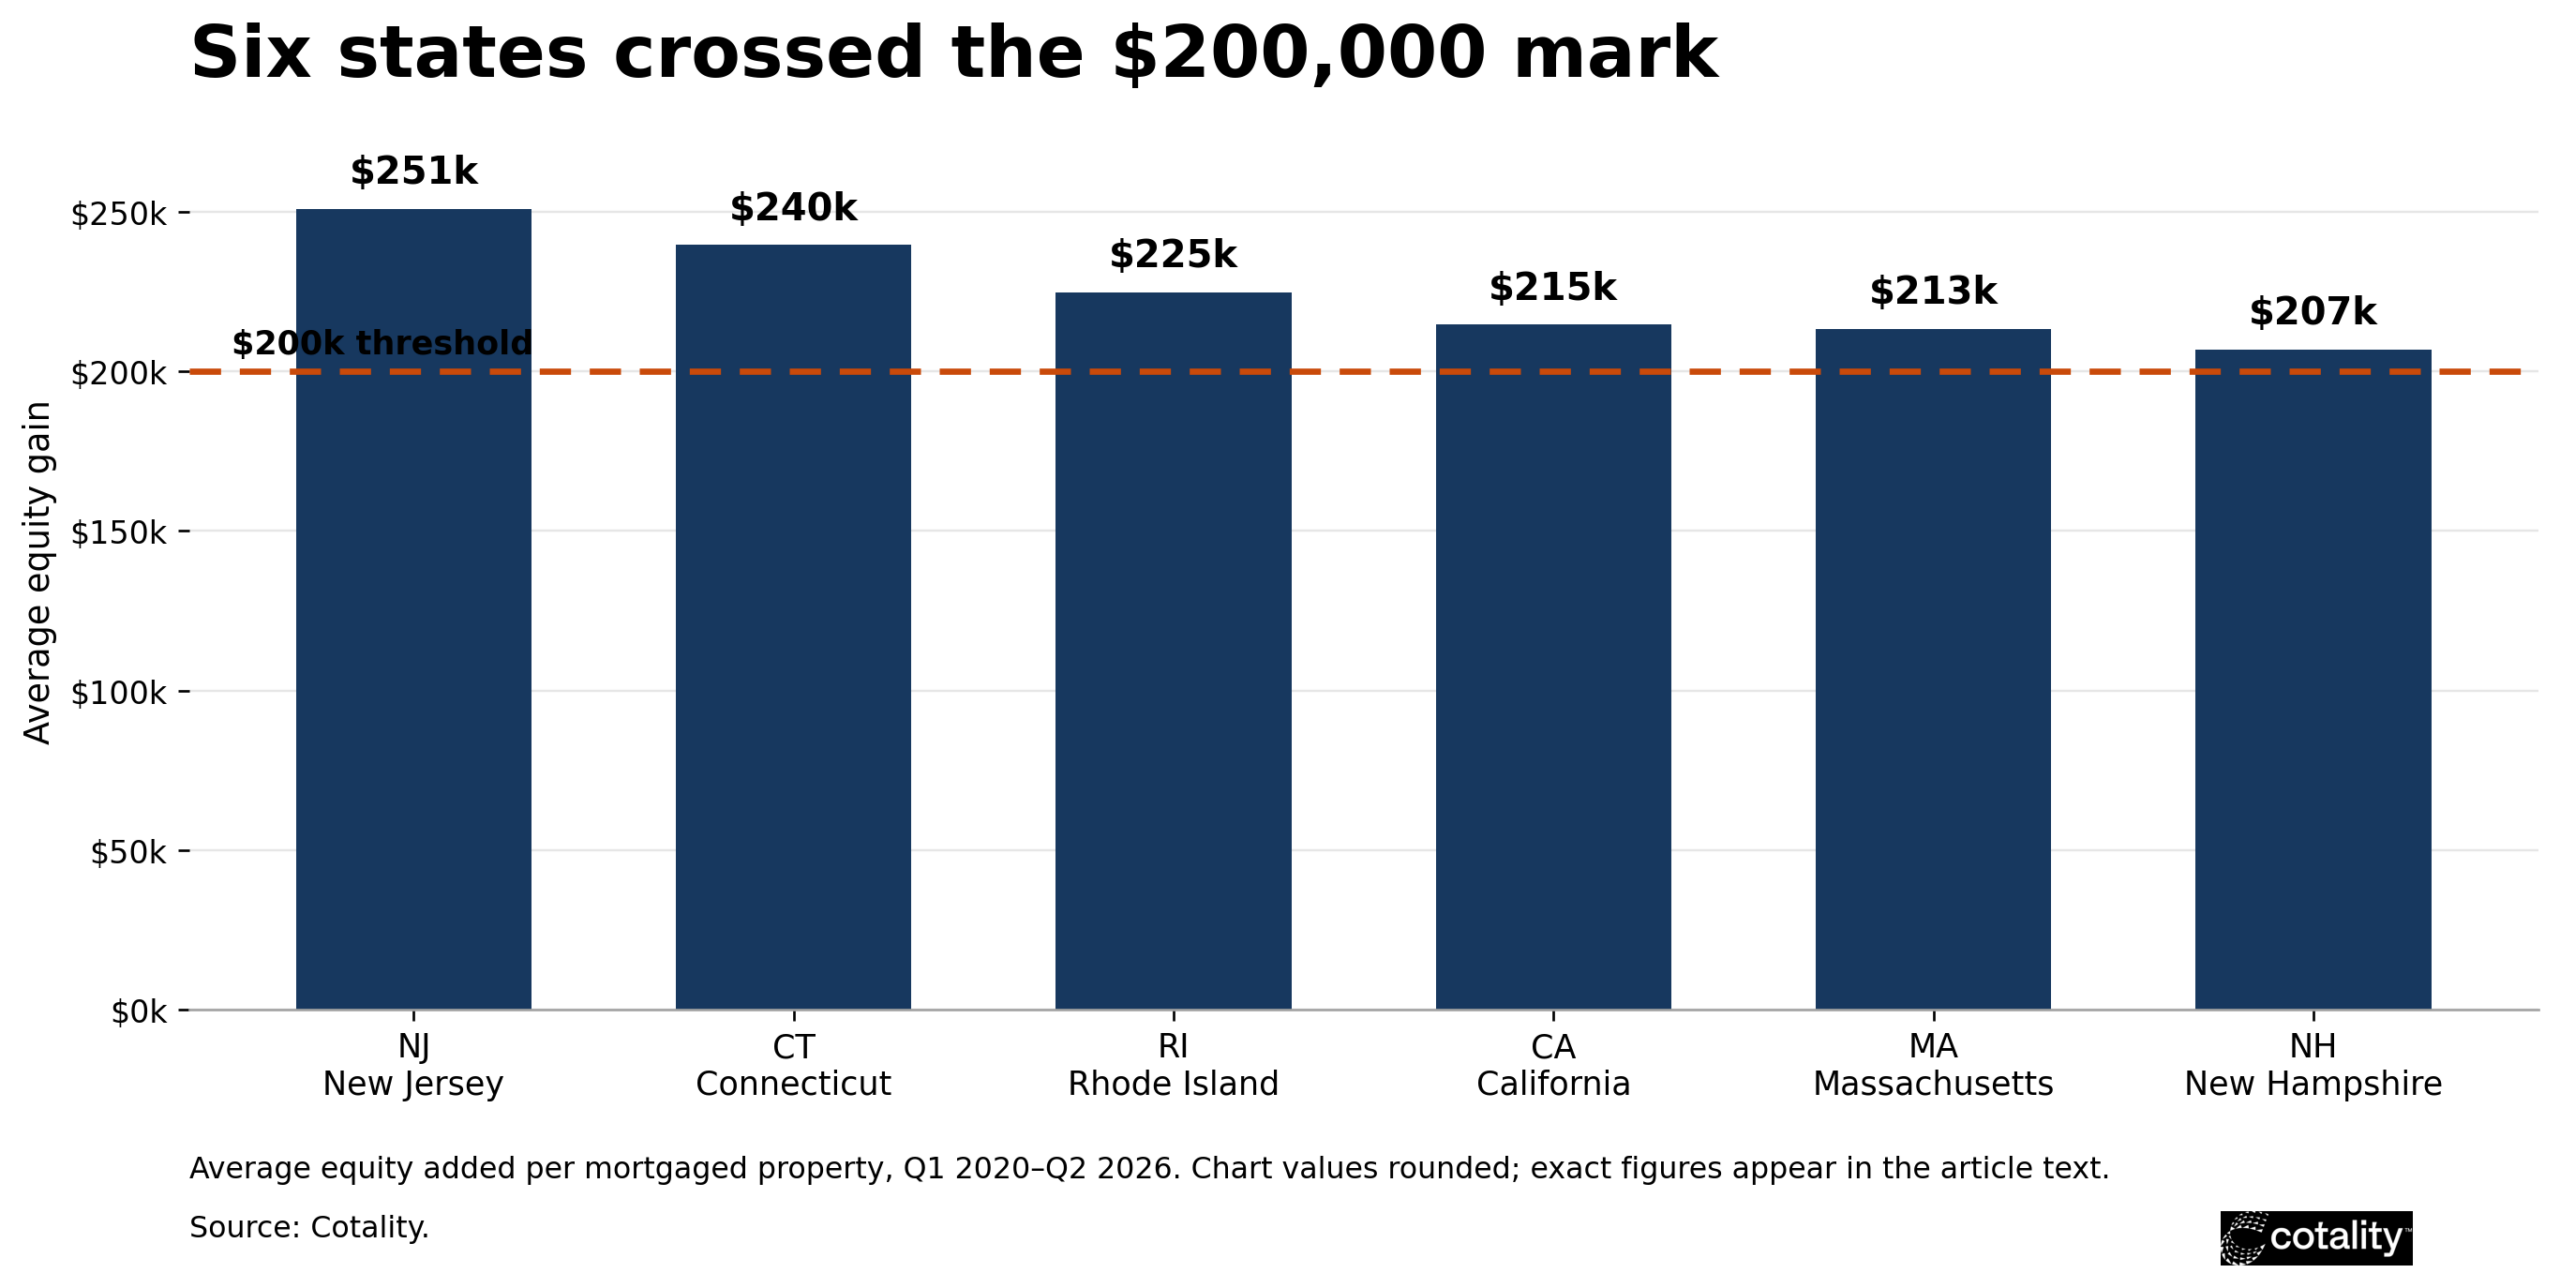
New Jersey led at $250,861, followed by Connecticut ($239,653), Rhode Island ($224,813), California ($214,632), Massachusetts ($213,288) and New Hampshire ($206,811). Vermont is not reported in this dataset; Delaware is excluded because its gain entry duplicates its current equity balance. Full coverage and definitions appear in the methodology.
The places gaining equity are not the only places under pressure
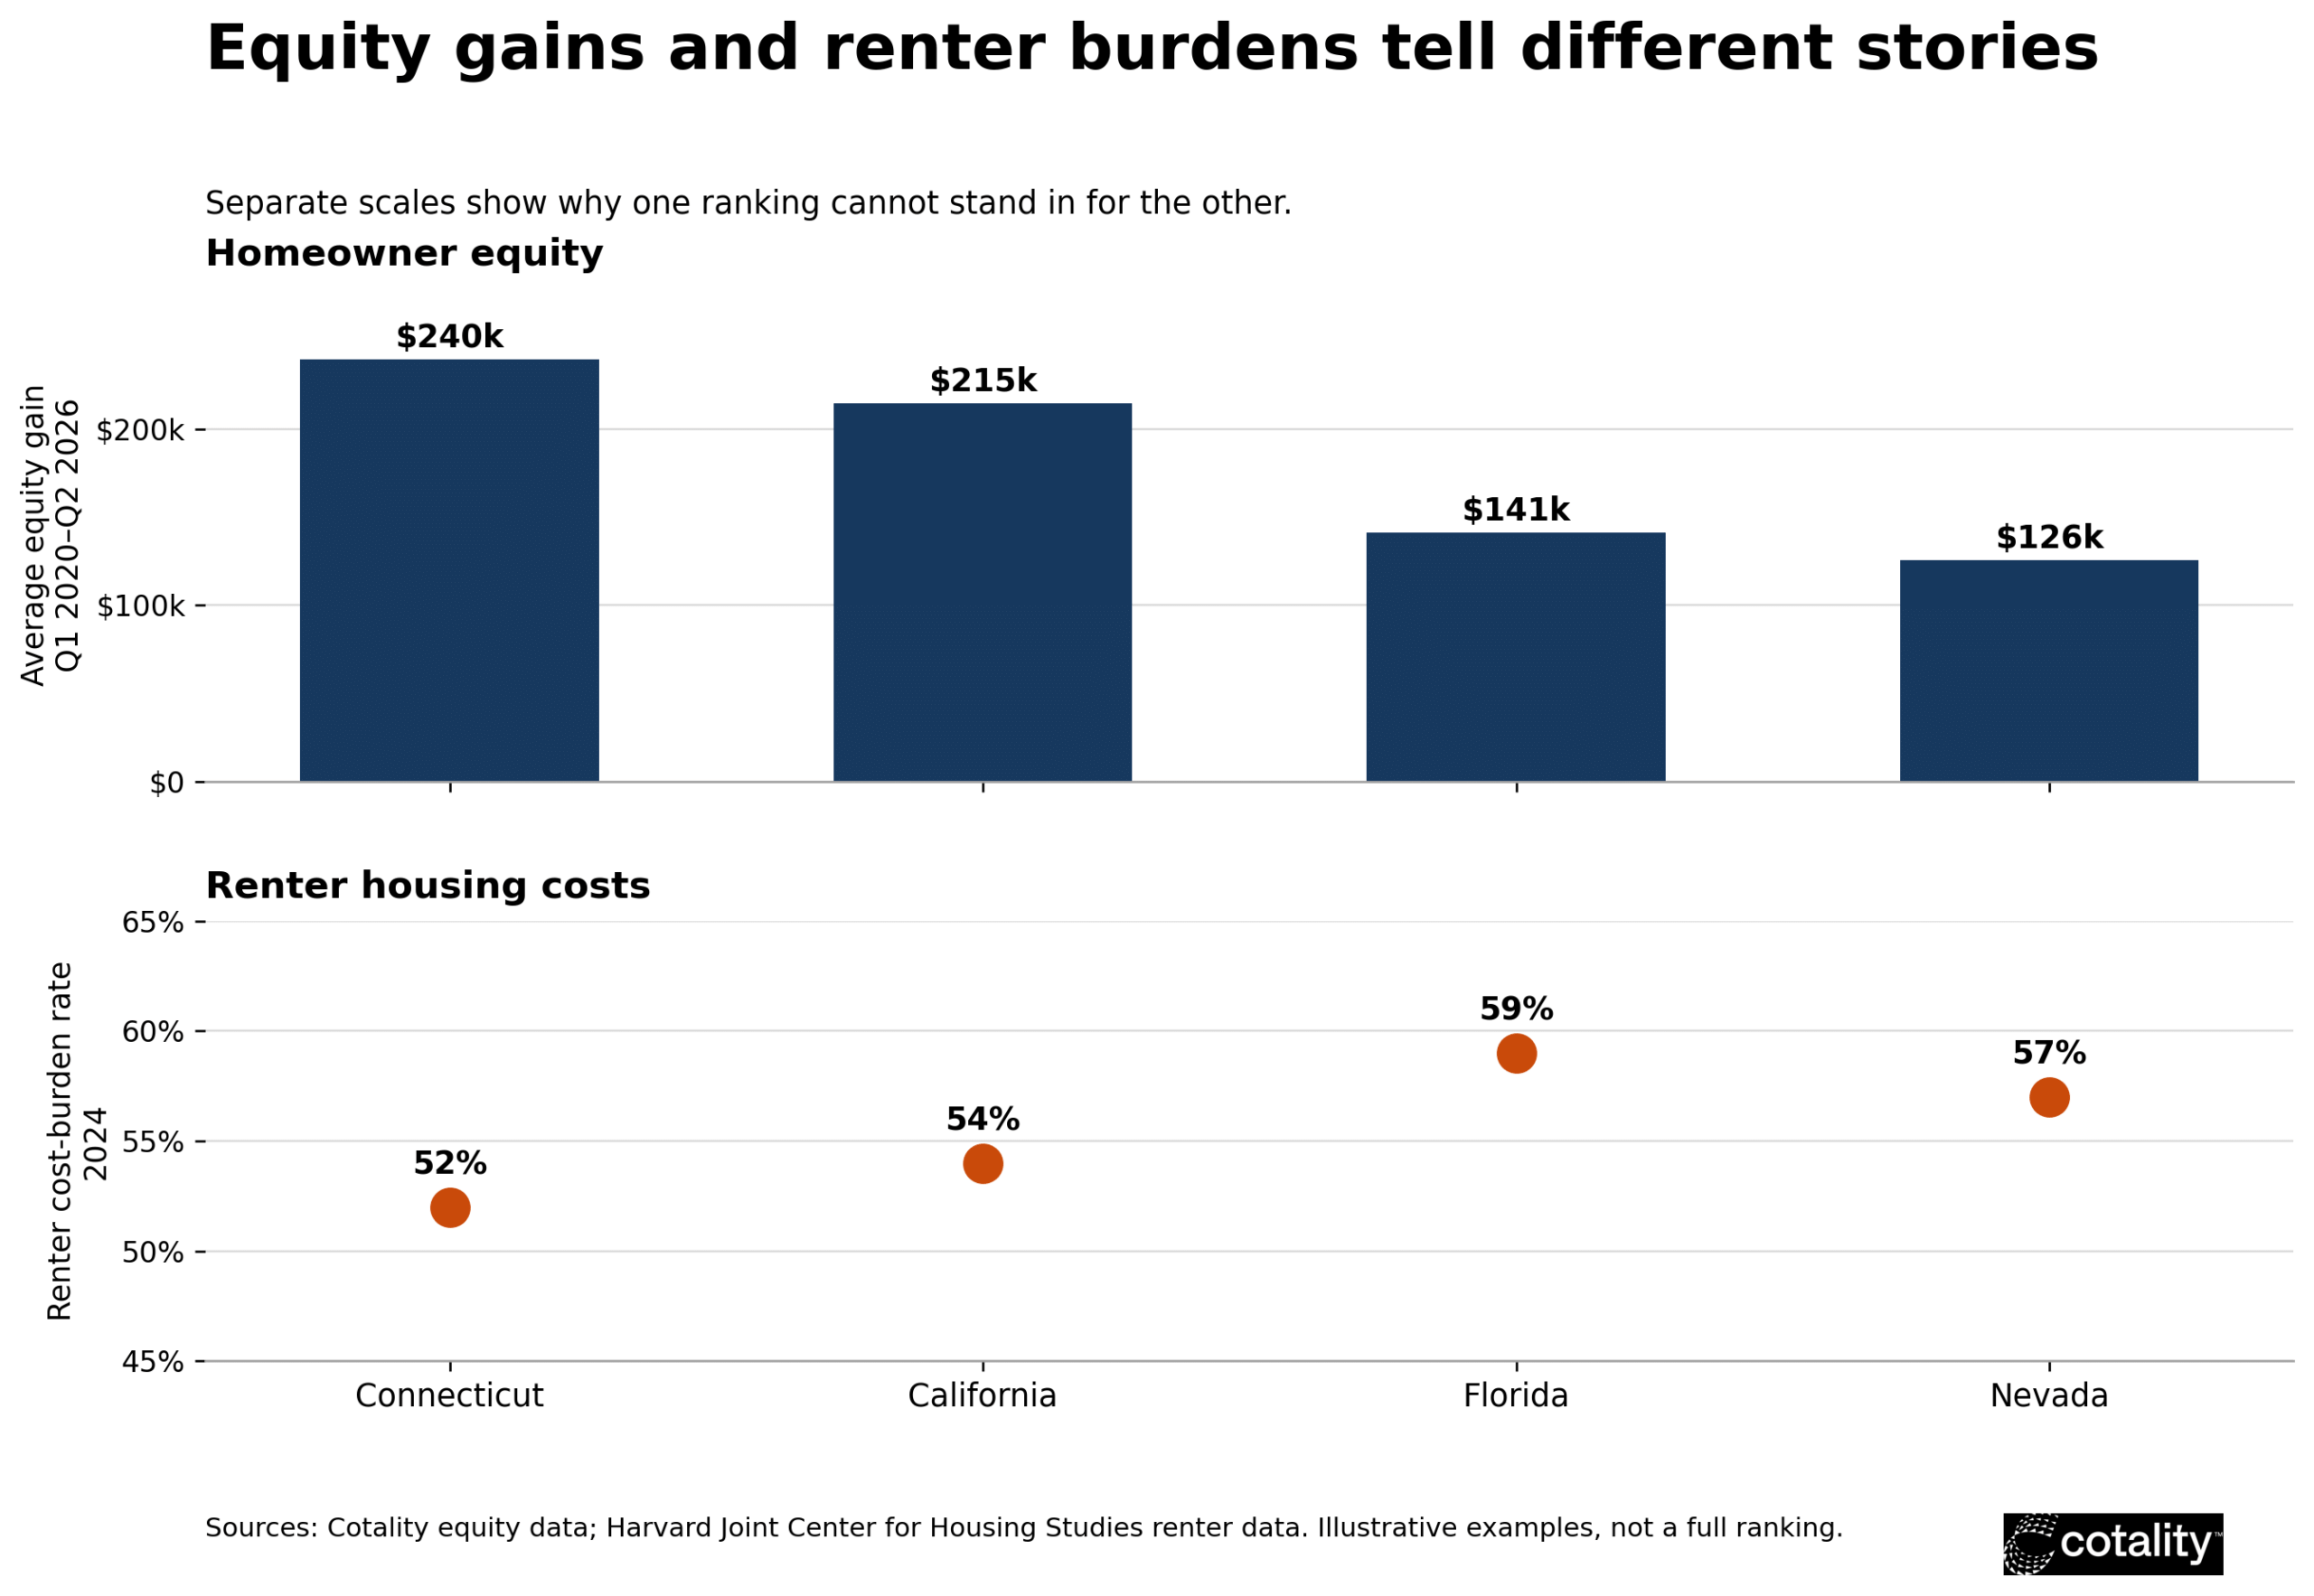
Connecticut’s reported equity increase was $239,653, while 52 percent of its renters were cost-burdened in 2024. California’s gain was $214,632, alongside a 54 percent renter-burden rate. The state cost-burden figures in Harvard’s report describe housing expenses relative to income, not renters’ assets.
The contrast also works in the other direction. Florida and Nevada had smaller equity gains, at $141,315 and $125,510, but higher renter-burden rates of 59 percent and 57 percent. These four examples show why an equity-gain ranking cannot stand in for a renter-hardship ranking.
Nationally, 22.7 million renter households were cost-burdened in 2024, including 12.1 million spending more than half their income on housing and utilities. A household putting that much toward shelter has less room to build emergency reserves, contribute to retirement accounts or save for a down payment.
Percentage gains can conceal a widening dollar gap
The Federal Reserve’s latest available Survey of Consumer Finances supplies a separate, inflation-adjusted measure of the national wealth divide. Median homeowner net worth rose from $295,500 in 2019 to $396,200 in 2022. For renters and other non-homeowners, it increased from $7,300 to $10,400. All four figures are expressed in 2022 dollars.
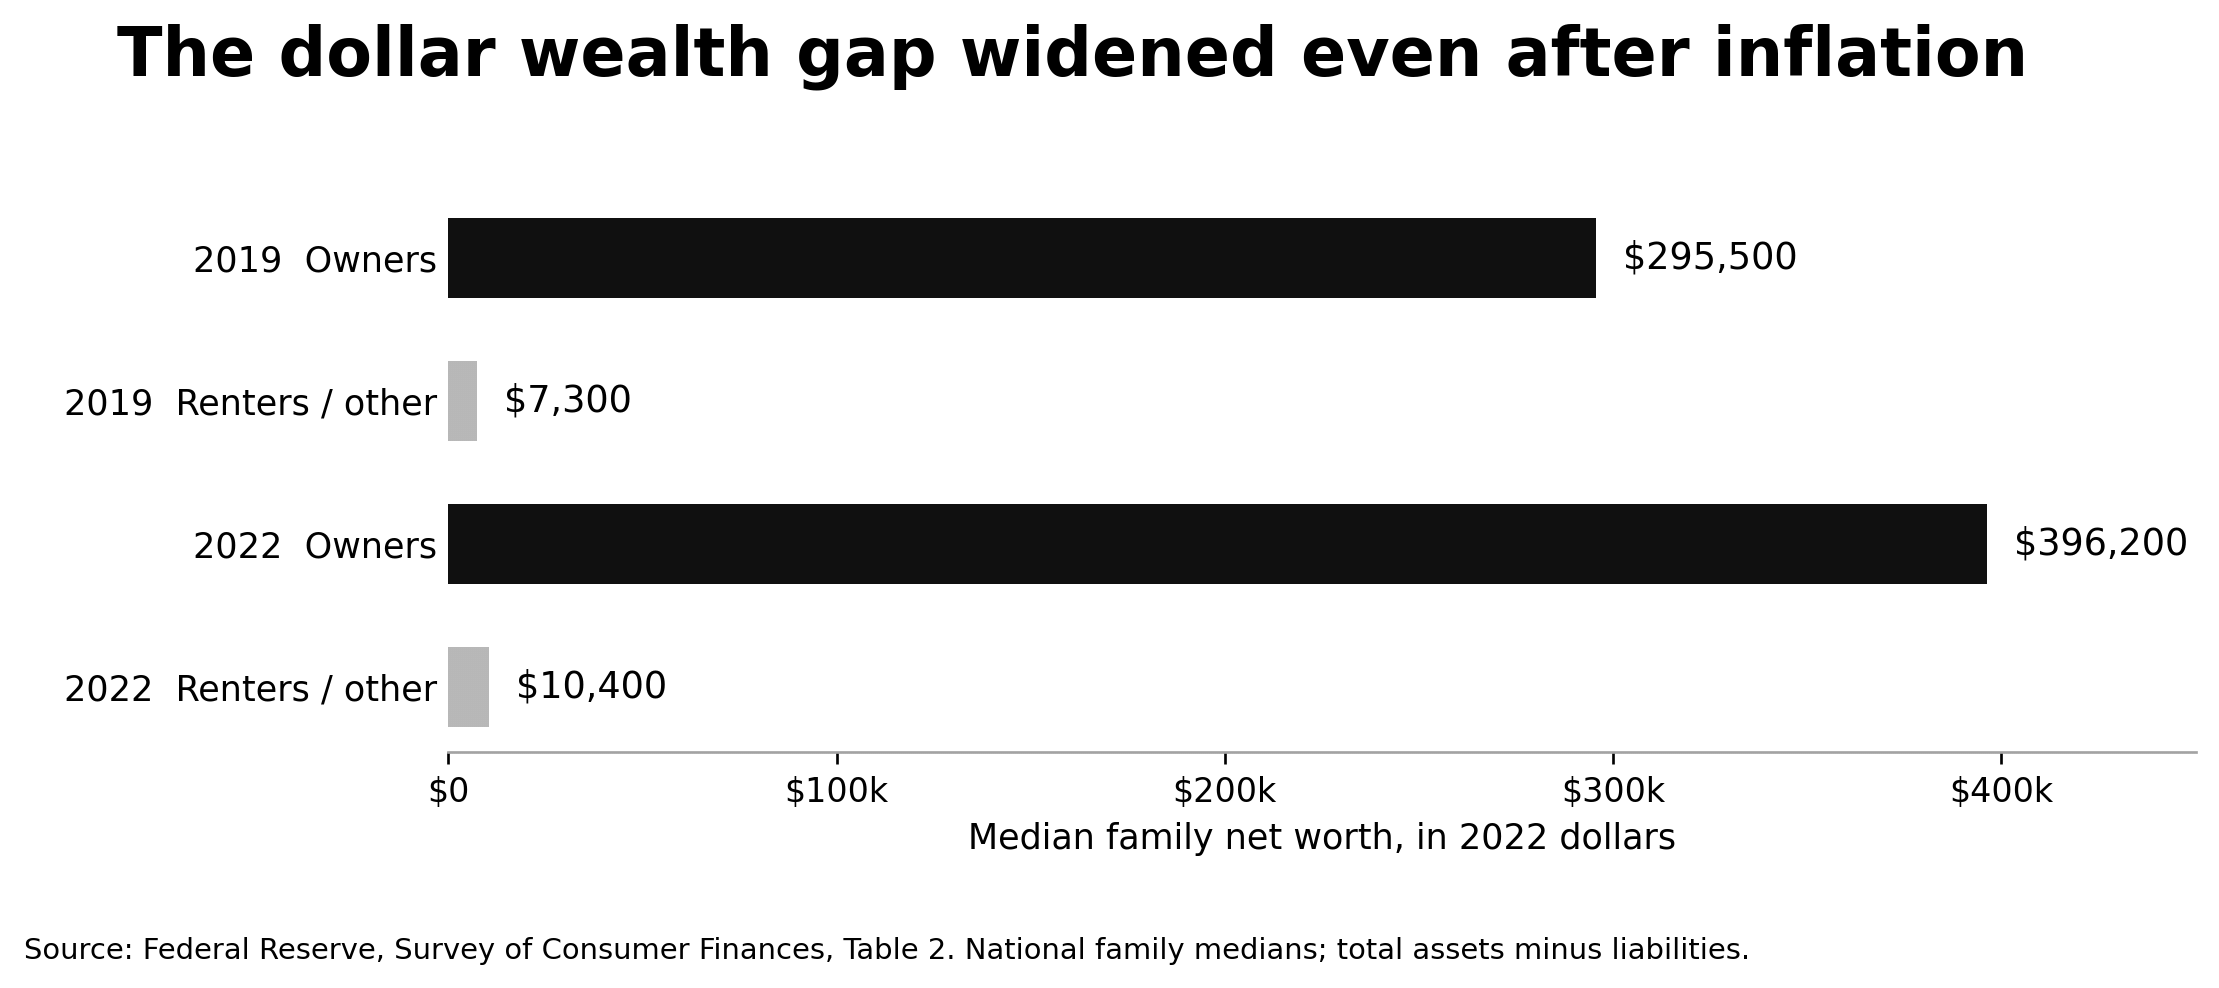
Source: Federal Reserve, Table 2. National family medians; total assets minus liabilities, not home equity alone.
The difference between those medians widened by $97,600, even though non-homeowners’ wealth grew faster in percentage terms. A large percentage increase from a small starting balance can still leave a household further behind in dollars. These group comparisons do not establish that ownership alone caused the gap.
A slower market does not erase the advantage of buying earlier
An owner can retain substantial gains even after home-price growth slows. That distinction matters for a renter waiting for affordability to improve: a market that stops booming has not necessarily returned to its earlier prices.
Cotality’s separate analysis of purchase timing reports that buyers who purchased in 2020 or 2021 accumulated about $86,000 more equity than those who purchased in 2022 or later. That comparison concerns purchase cohorts, not renters, but it illustrates how the timing of entry can shape a household’s accumulated cushion.
Washington, D.C., makes a related point about geography. Its $31,540 equity gain was below every state in this comparison, yet Cotality placed it ninth in current average equity among the jurisdictions reported. A place can hold substantial housing wealth without leading recent gains.
None of these figures makes a future gain certain. Falling values can erode equity, and additional borrowing can reduce an owner’s stake. The economic advantage is the cushion already accumulated, not a promise that it will keep growing.
The lasting divide is in the options available
Equity and cash flow solve different problems. Accumulated housing wealth may support a move, retirement or assistance to a family member. But paying an unexpected bill requires available cash or access to financing, and a valuable home does not guarantee either.
A second-lien HELOC or home equity loan can leave an existing first mortgage in place. A cash-out refinance replaces it with a larger loan. Both add debt secured by the home. Borrowing changes how a household accesses its wealth; it does not create new wealth by itself.
Renters can build assets through savings, retirement accounts, investments and businesses. Renting can also preserve flexibility and avoid ownership costs. The difficulty arises when housing expenses leave too little money to pursue those alternatives.
That is why the policy stakes extend beyond the next home-price reading. More attainable homes can widen access to ownership, while affordable rentals can make saving possible before a household buys, or for households that never do. A stronger balance sheet should not require having entered the housing market before a particular boom.
The test of the home equity boom is not simply how much wealth existing owners accumulated. It is whether the households still outside it can build financial security of their own.
Methodology
Griffin Funding sorted Cotality’s published gain chart; it did not produce the underlying equity estimates. The metric is the nominal change in average equity per mortgaged residential property from Q1 2020 to Q2 2026. Mortgage-free properties are excluded. Changing property and borrower composition can affect averages; this is not a fixed-cohort study.
The state gains are not inflation-adjusted. Calculating real gains would require expressing the starting and ending equity balances in the same period’s dollars before subtracting; simply discounting the nominal increase would not measure the change in purchasing power correctly. The Federal Reserve comparison above already uses constant 2022 dollars.
State comparison and source notes
The map and charts use the source chart’s values, rounded to the nearest thousand for display. Cotality’s release narrative rounds Texas to $58,000; the source chart reports $57,437, which appears as $57,000 on the map. The map covers the 48 included states.
Vermont’s absence reflects Cotality’s coverage, not a low ranking. Griffin Funding’s earlier equity-rich state comparison used ATTOM’s share of mortgaged properties with at least 50 percent equity, a different measure and dataset. Delaware is excluded because its gain entry duplicates its current equity balance. D.C. is shown on the map as unranked at $31,540.
Renter statistics describe 2024 and come from Harvard’s 2026 report, printed pages 32–33. The four state examples are illustrative, not a full pairing of renter burden across the ranking or a test of causation. The national wealth comparison uses the Fed’s 2019 and 2022 surveys. Equity data were retrieved for the original analysis on September 18, 2026.
Find the best loan for you. Reach out today!
Get Started
Bill Lyons is the Founder, CEO & President of Griffin Funding. Founded in 2013, Griffin Funding is a national boutique mortgage lender focusing on delivering 5-star service to its clients. Mr. Lyons has 25 years of experience in the mortgage business. Lyons is seen as an industry leader and expert in real estate finance. Lyons has been featured in Forbes, Inc., Wall Street Journal, HousingWire, and more. As a member of the Mortgage Bankers Association, Lyons is able to keep up with important changes in the industry to deliver the most value to Griffin's clients. Under Lyons' leadership, Griffin Funding has made the Inc. 5000 fastest-growing companies list six times in its 13 years in business. Follow his updates on LinkedIn.
 Outstanding Client Experience
 Specialized Lending Solutions
 Direct-to-Consumer Advantage
 We're Advisors, NOT Salespeople
 Effortless Digital Mortgage Platform
Featured In



Recent Posts
The rise of the five-house landlord: Wall Street blinked, small investors kept buying
In a single month, America’s biggest landlords cut their share of home purchases nearly in half. Firms t...

Mortgage rates hit 18% in 1981. Here’s how that compares with buying a home today
Borrowers shopping for a 30-year fixed mortgage in the fall of 1981 saw rates peak at 18.63% in the week of Oc...
Average home equity gains topped $200,000 in six states as renters faced heavy housing costs
A rising home value can mean two very different things on the same street. For an established homeowner, it ca...