

Conforming mortgages just lost their majority. Non-QM is helping drive the shift

 Written by Bill Lyons


Conforming mortgages accounted for nearly three-quarters of Optimal Blue’s rate-lock volume in July 2020. Six years later, they no longer make up half of it.
Conforming mortgages fell below half of Optimal Blue rate-lock volume in April, the first time that had happened since at least January 2018. Conforming share was 47% in July and remained at 47% in August, while non-qualified mortgage (Non-QM) loans rose from more than 10% of locks in July to more than 11% in August.
Griffin Funding looked back at six years of Optimal Blue rate-lock data to see how much the market had changed. In July 2020, conforming loans accounted for 73.1% of product share. By July 2026, that figure had fallen 26.1 percentage points to 47%. Separately reported Non-QM snapshots moved in the other direction, rising from about 1.4% in August 2020 to 8.34% in August 2025 and more than 11% in August 2026.
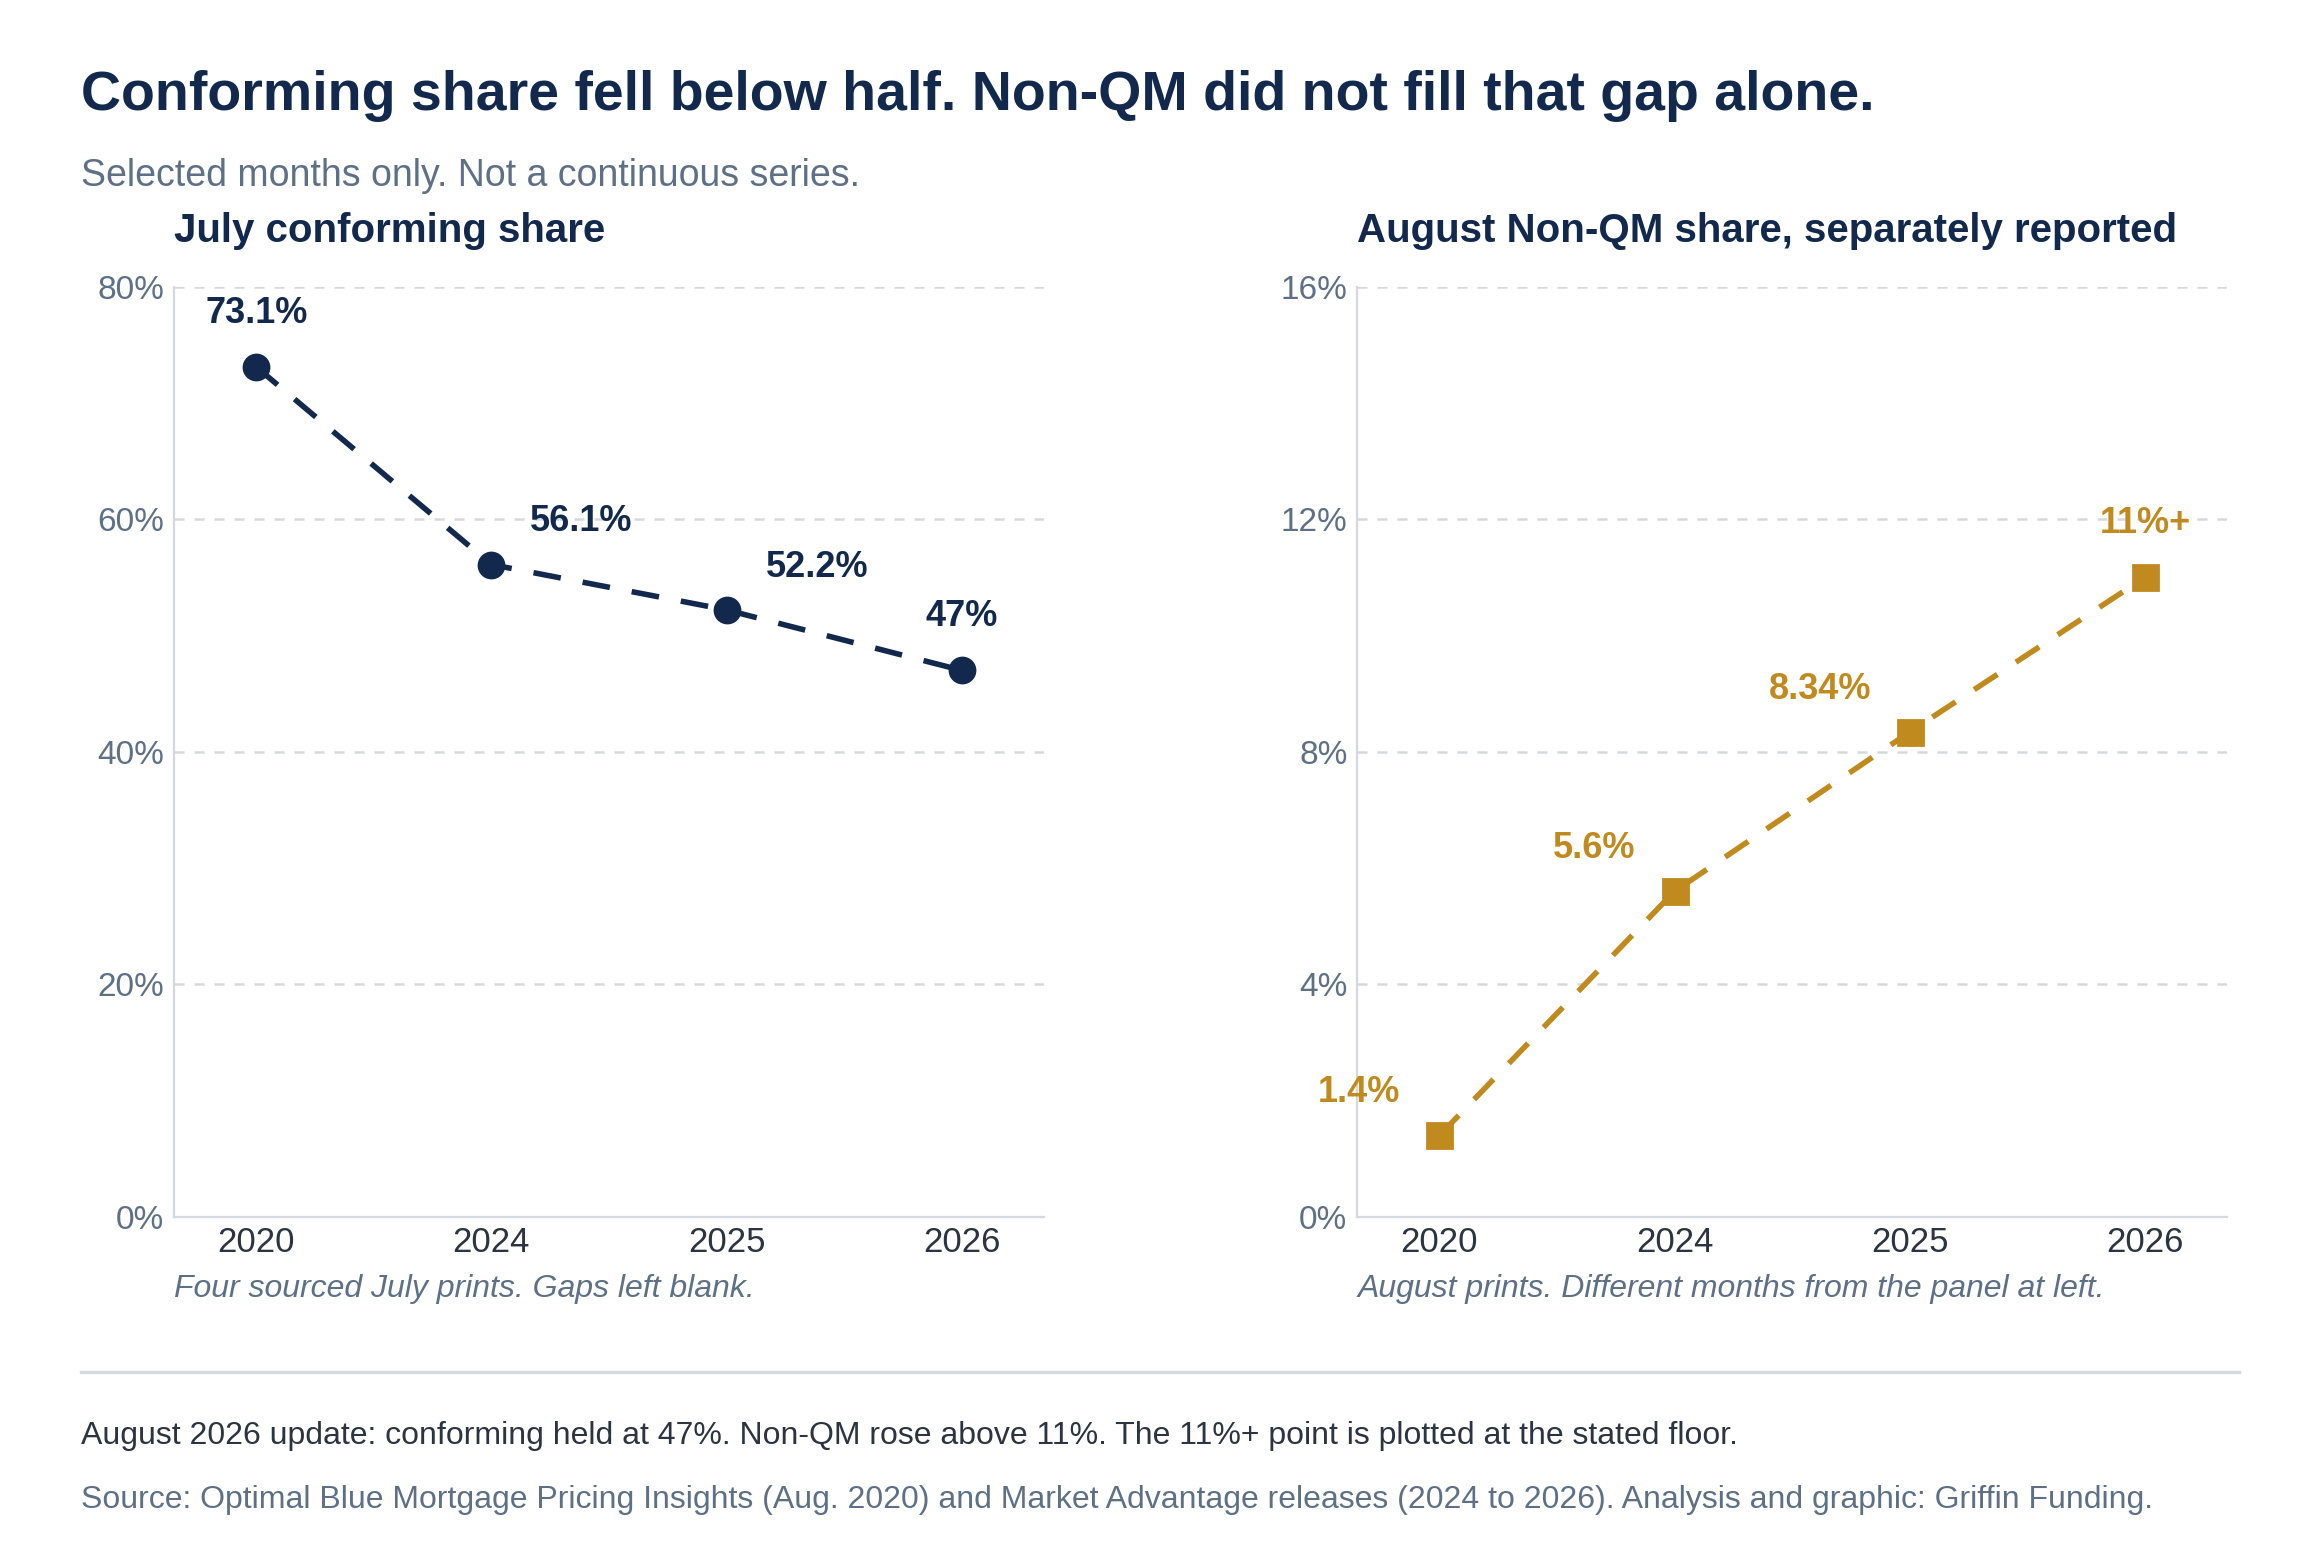
The conforming figures are July prints; the Non-QM figures are separately reported August prints. Gap years are unsourced and left out.
The missing conforming share did not simply move into FHA or VA
The most useful comparison is what happened to the rest of the mortgage mix. From July 2024 to July 2026, conforming share fell from 56.1% to 47%, a decline of 9.1 percentage points. Over the same period, the broader non-conforming bucket, which includes jumbo and Non-QM loans, rose from 12.4% to nearly 21%, an increase of roughly 8.6 points.
FHA stayed near 19% across the comparison. VA moved only modestly. That does not prove individual borrowers migrated directly from conforming loans into non-conforming products, but it does show where the market-share expansion occurred: overwhelmingly outside the GSE-eligible conforming channel.
Non-QM did not replace conforming one-for-one. Jumbo lending grew as well, and some high-balance Non-QM loans blur the line between the two. The market is simply less concentrated in one channel than it used to be.
Non-QM is taking a larger share of that expansion
Optimal Blue’s year-over-year data show how quickly Non-QM gained ground. From August 2024 to August 2025, its share of mortgage activity rose from 5.6% to 8.34%, an increase of nearly 49%. By August 2026, Non-QM had risen above 11% of rate-lock volume.
A Bank of America Securities analysis reported by HousingWire estimates Non-QM originations reached $108 billion in 2025 and projects that volume will rise to $175 billion in 2026, an increase of roughly 62% and a new post-crisis high.
The growth is concentrated in investors and borrowers with nontraditional income
A closer look at the Non-QM market shows where much of that growth is coming from. Optimal Blue’s August 2026 data show that investor and debt-service-coverage-ratio loans represented more than 35% of Non-QM production, while bank-statement loans accounted for nearly 30%. Other expanded-guideline products made up the remainder.
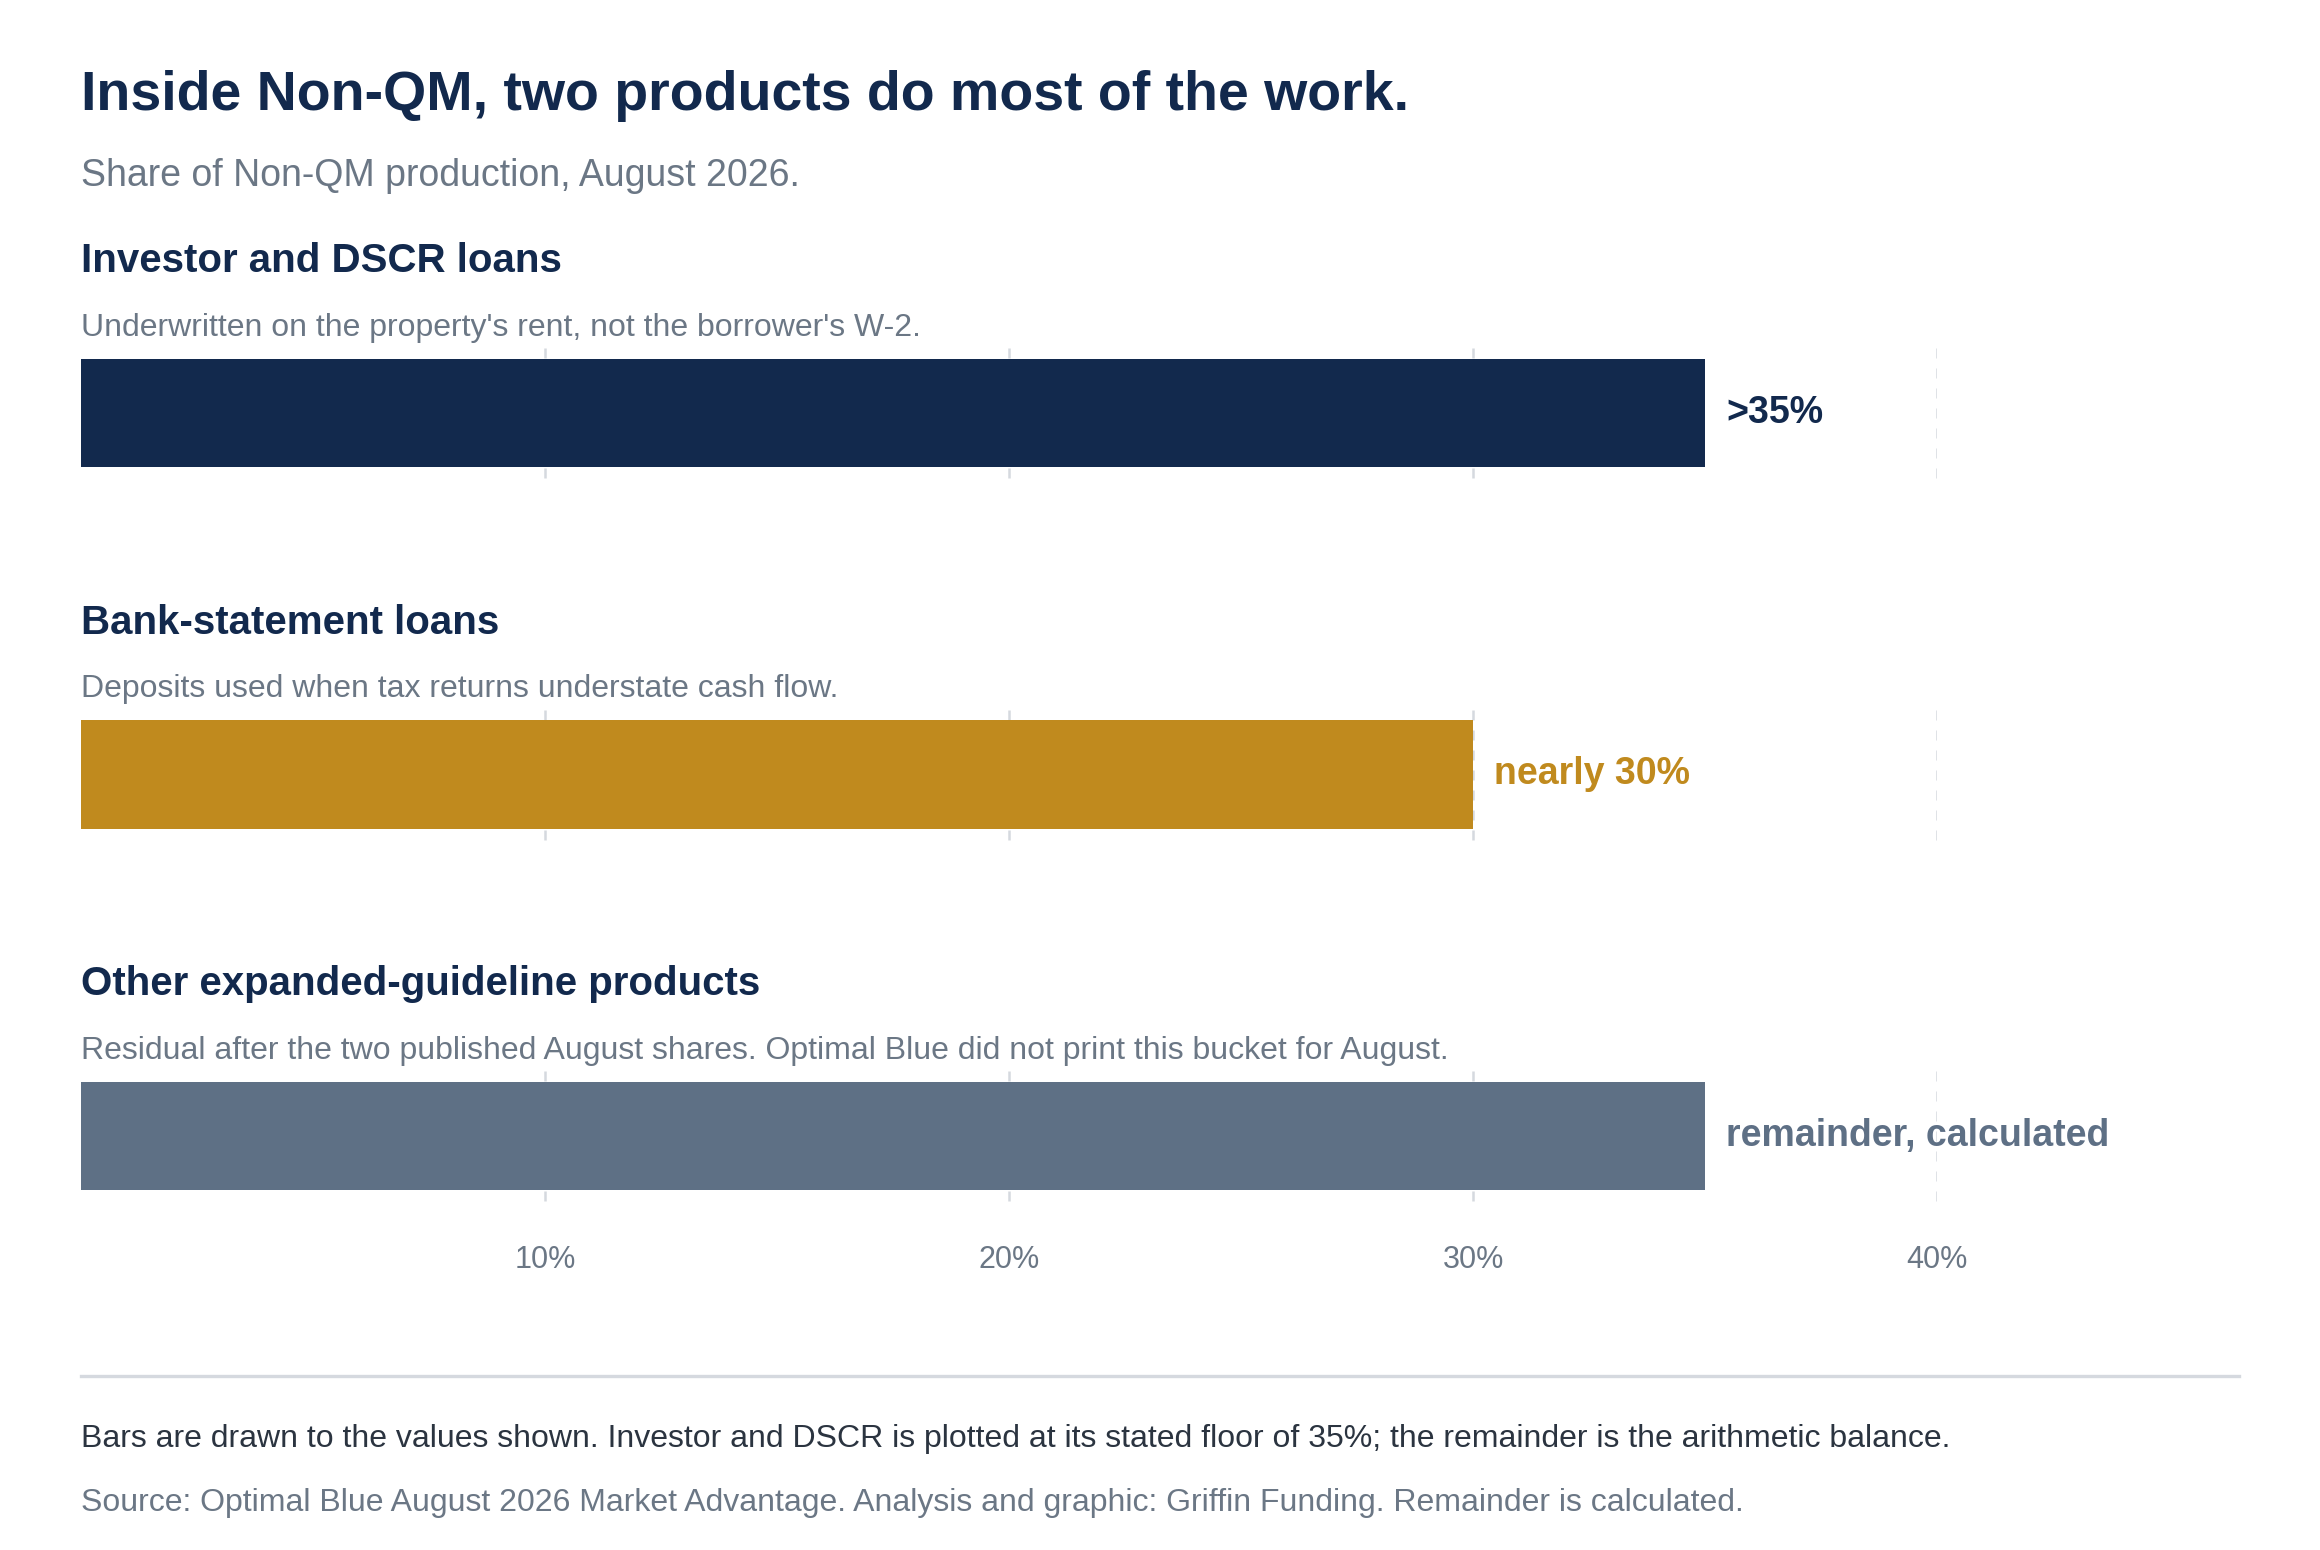
This analysis is based on the August 2026 composition. The third share is the balance after the two published by Optimal Blue, not a figure Optimal Blue reported.
Together, those products serve two groups that often fall outside traditional agency underwriting: real estate investors qualifying through property cash flow and borrowers documenting income through bank statements.
The mix inside Non-QM is changing, too. Investor and debt-service-coverage-ratio (DSCR) loans represented 29% of Non-QM production in July 2025. Their share rose above one-third by July 2026 and exceeded 35% in August 2026, even as the broader Non-QM market continued to grow.
For real estate investors, DSCR loans are underwritten primarily using the rental property’s cash flow rather than the borrower’s personal employment income. For self-employed borrowers, bank-statement loans can use deposits to document qualifying income when tax-return income does not fully reflect business cash flow.
Higher home prices are part of the story, but not the whole story
Rising home prices are an obvious part of the explanation. As more borrowers move above agency loan limits, non-conforming lending naturally grows. The changing borrower and product mix suggests other factors are contributing too.
FHFA raised the baseline conforming loan limit to $832,750 for 2026, up $26,250 from 2025, with a high-cost ceiling of $1,249,125. Raising the limit allows more large mortgages to remain eligible for purchase by Fannie Mae and Freddie Mac. Non-conforming share nevertheless continued to climb.
At the same time, large loans are increasingly showing up inside Non-QM itself. Bank of America Securities estimates loans above $1 million account for about 28% of new 2026 Non-QM production, up from 20% in 2018. That suggests the non-agency market is expanding on multiple fronts: traditional jumbo borrowers, investors using DSCR, self-employed borrowers using alternative documentation, and high-balance loans moving through Non-QM channels.
This is not the same market as pre-2008 subprime
The label “Non-QM” can make the current expansion sound like a return to the loose-credit mortgage market that preceded the financial crisis. The label alone does not establish whether a loan has weak credit.
Today’s non-agency market includes investor loans underwritten using property cash flow, bank-statement programs that offer another way to document income, and high-balance loans that do not fit traditional agency channels. Some business-purpose investor loans may be exempt from federal Qualified Mortgage rules, even though the industry commonly groups them with Non-QM lending. These products carry different risks and pricing than conforming mortgages, but they do not automatically indicate weak credit.
Bank of America Securities also found that delinquencies have climbed among Non-QM loans originated between 2022 and 2024, especially cash-out refinances, bank-statement loans and loans to borrowers with multiple mortgages. But losses remain low: 3.6 basis points across roughly $281 billion in Non-QM loans originated and securitized since 2018. Loans originated in 2025 have performed better after lenders tightened standards.
The more important shift is structural: A larger share of mortgage demand now comes from borrowers and properties that need a different underwriting calculation than the conforming market was designed to provide.
The conforming mortgage is no longer the only center of the market
Conforming lending remains the single largest mortgage category. It held 47% of Optimal Blue rate-lock volume in August 2026, making it the largest category, but it is no longer a majority.
What replaced that majority is not one product. It is a more fragmented market: government lending, jumbo mortgages, DSCR loans, bank-statement loans and other expanded-guideline programs serving different borrower and property profiles.
That growth is one sign of a broader shift. The mortgage market is adapting to how Americans earn income, invest in property and finance increasingly expensive homes. Conforming loans now occupy a smaller part of that landscape.
Methodology and how to read this analysis
Griffin Funding analyzed publicly reported mortgage rate-lock shares from Optimal Blue’s Mortgage Pricing Insights and Market Advantage reports. Optimal Blue reports that its platform is used to price and lock more than one-third of mortgages nationwide. The figures represent activity on that platform, not a census of every U.S. mortgage lock or the stock of outstanding mortgages.
Historical comparisons use the exact months stated because not every product-share figure is publicly available for every month. Optimal Blue groups jumbo and Non-QM loans within its broader non-conforming category, so those figures should not be interpreted as a pure measure of either segment on its own.
The analysis is descriptive. Changes in category share do not establish that individual borrowers moved directly from one loan type to another. Bank of America Securities forecasts and market estimates are cited as projections, not realized 2026 full-year totals.
Estimates of total Non-QM volume vary by source and methodology. Griffin Funding’s earlier analysis of HMDA loan-level data found that Non-QM accounted for roughly 10% of 2025 originations by dollar volume, while Bank of America Securities estimated $108 billion for the same year. The figures are not directly comparable because the sources use different definitions and methodologies, and neither should be compared directly with totals produced from broader loan-level datasets.
This story was produced by Griffin Funding and reviewed and distributed by Stacker.
Find the best loan for you. Reach out today!
Get Started
Bill Lyons is the Founder, CEO & President of Griffin Funding. Founded in 2013, Griffin Funding is a national boutique mortgage lender focusing on delivering 5-star service to its clients. Mr. Lyons has 25 years of experience in the mortgage business. Lyons is seen as an industry leader and expert in real estate finance. Lyons has been featured in Forbes, Inc., Wall Street Journal, HousingWire, and more. As a member of the Mortgage Bankers Association, Lyons is able to keep up with important changes in the industry to deliver the most value to Griffin's clients. Under Lyons' leadership, Griffin Funding has made the Inc. 5000 fastest-growing companies list six times in its 13 years in business. Follow his updates on LinkedIn.
 Outstanding Client Experience
 Specialized Lending Solutions
 Direct-to-Consumer Advantage
 We're Advisors, NOT Salespeople
 Effortless Digital Mortgage Platform
Featured In



Recent Posts
Mortgage rates hit 18% in 1981. Here’s how that compares with buying a home today
Borrowers shopping for a 30-year fixed mortgage in the fall of 1981 saw rates peak at 18.63% in the week of Oc...

Average home equity gains topped $200,000 in six states as renters faced heavy housing costs
A rising home value can mean two very different things on the same street. For an established homeowner, it ca...
A 1-percentage-point mortgage rate rise can outrun 4 years of rent growth
The Federal Reserve raised interest rates on Sept. 16 for the first time since 2023. For rental property inves...